In my Setting Up a Debian VM, Step by Step tutorial I showed you how to install and enable Xdebug on a VM but I didn’t really explain what Xdebug is, why you should use it, or how to actually begin working with it.
Xdewhatchamacallit?
Xdebug is a PHP extension that was written and is maintained by Derick Rethans. It provides debugging and profiling capabilities, although I’ll be mostly focusing on the debugging aspects in this tutorial.
With it you can set a breakpoint and pause the execution of a script to see the state of your application at that exact point, including what variables/objects have been instantiated and what their values are.
Xdebug completely replaces the need to litter your code with echo, print_r() or var_dump() calls, and displays information on all variables, not just the one you passed.
It also allows you to change the values of one or more variables on the fly, affecting the execution of your application.
IDE/Text Editor Support
Most modern IDEs support debugging of some sort, although depending on the IDE you may be required to use a different extension. For example, Zend Studio does not officially support Xdebug, and in my tests it simply does not work – you need to use their own Zend Debugger. PHPed has a proprietary “PHP Debugger” extension.
Netbeans has an issue (1, 2, 3) with Xdebug where it throws a socket exception while debugging, rendering it kind of useless for any real debugging sessions. I will keep an eye on this IDE’s status and update this article as soon as I see that it works.
Some text editors have plugins for Xdebug support, like Notepad++, Sublime Text 2 and even Vim.
My favorite IDE is JetBrains’ PhpStorm which provides native support for Xdebug and I will write this tutorial with it in mind. PhpStorm is a full-fledged IDE that is developed by the same team that has created IntelliJ IDEA. It is not free (except for educational institutions or open source projects) at $99, but in my opinion this is a must-have tool that just works and is worth every penny.
edit: It appears ActiveState Komodo IDE supports Xdebug, but the price tag of $295 may be too much to pay for many non-professional developers.
The steps to get Xdebug working in your favorite IDE/text editor will differ, but the basic steps should remain the same and you should refer to its documentation.
Installing Xdebug
If you’ve followed my Setting Up a Debian VM, Step by Step tutorial then you should already have Xdebug installed and enabled. You can safely skip this step.
We’ll clone Xdebug from Github and compile it:
1
2
3
4
5
6
7
$ cd
$ git clone git://github.com/derickr/xdebug.git
$ cd xdebug*
$ phpize
$ ./configure --enable-xdebug
$ make
$ sudo make install
After that’s done, add the settings to your php.ini:
1
2
3
4
5
6
7
8
9
[xdebug]
zend_extension=/usr/local/lib/php/extensions/no-debug-non-zts-20100525/xdebug.so
xdebug.remote_enable=1
xdebug.remote_connect_back=1
xdebug.remote_port=9000
xdebug.show_local_vars=0
xdebug.var_display_max_data=10000
xdebug.var_display_max_depth=20
xdebug.show_exception_trace=0
If you’re using PHP 5.3,
zend_extensionshould be/usr/local/lib/php/extensions/no-debug-non-zts-20090626/xdebug.so
Restart Apache and call phpinfo(). Search for xdebug and you should find it.
Creating Xdebug Bookmarklet
Jetbrains, the creators of PhpStorm, have been nice enough to create an easy to use Xdebug/Zend Debugger bookmarklet. This bookmarklet allows you to simply click on a bookmark in your browser to instantiate an Xdebug session and just as quickly end it. It also provides bookmarklets for profiling and tracing features, which I will not be covering in this tutorial.
First, go to PhpStorm’s Zend Debugger & Xdebug bookmarklets generator for PhpStorm. These bookmarklets will work for any IDE, not just PhpStorm.
On the right side you’ll see the Xdebug IDE key field. Replace “PHPSTORM” with “xdebug”. This is the key Xdebug/your IDE will be listening for.
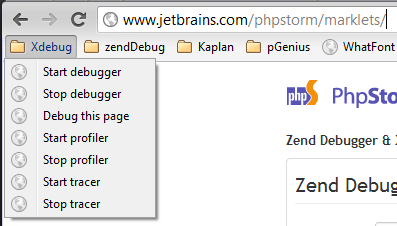
Clicking the “Generate” button will create 7 links below the form. You should drag these links into your browser’s bookmark bar. I like to save mine inside a folder for easy access:
 |
|---|
| bookmarklets.png |
Whenever you want to initiate a debugging session simply click the “Start debugger” bookmarklet, and “Stop debugger” to end the session. Extremely easy, and no need to mess with the URL to pass in Xdebug flags!
Your Code
I have set up a fresh vanilla install of WordPress to test out Xdebug. There’s nothing special about it, and you don’t need to change anything in the code to make it work.
I’ve setup a sample domain, wordpress.dev to try this out.
Xdebug debugging involves setting a breakpoint where you wish to pause script execution and then reloading the page in your browser. For the following steps, you should already be on a page in your application to proceed.
Setting up PhpStorm
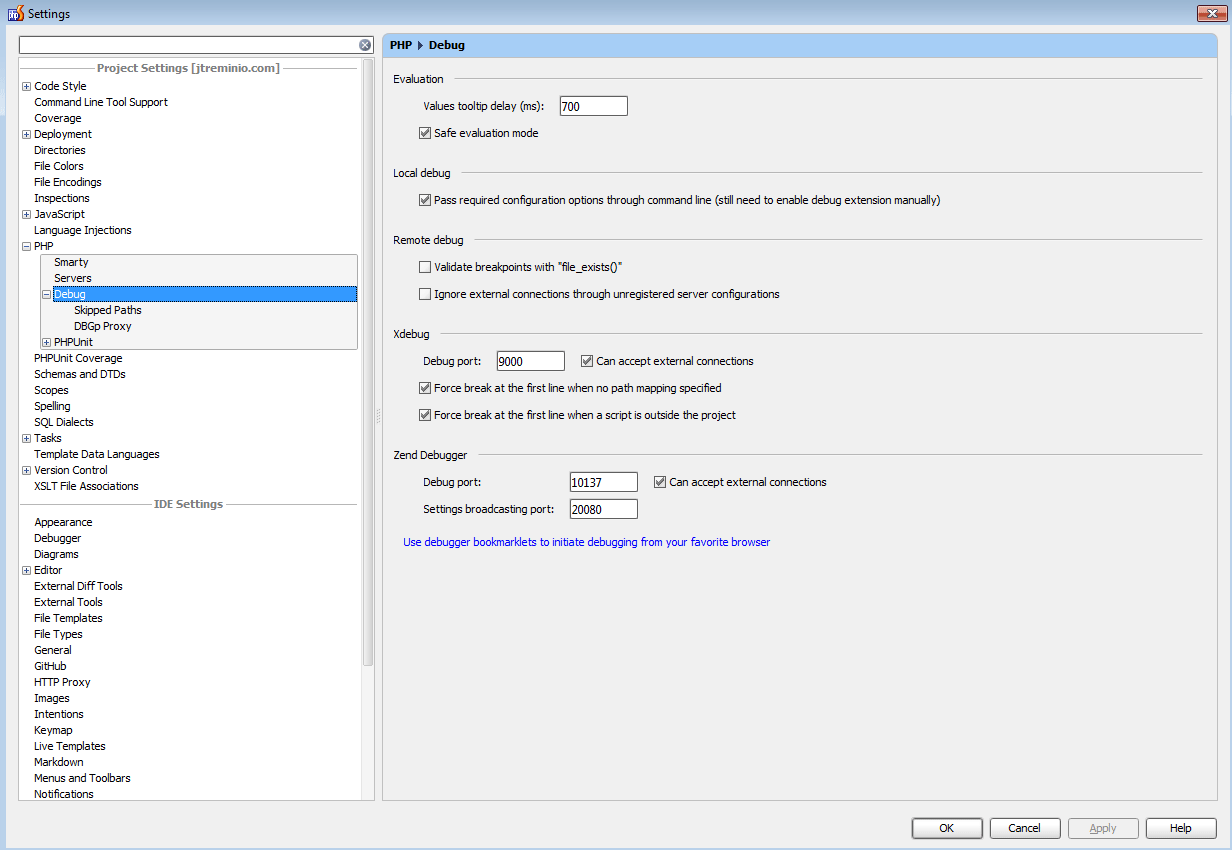
Open a project and go to the Settings. Click on PHP and then Debug on the left side. The settings should default to the following image, but if not make sure to update them:
 |
|---|
| phpstorm.php_.debug_.png |
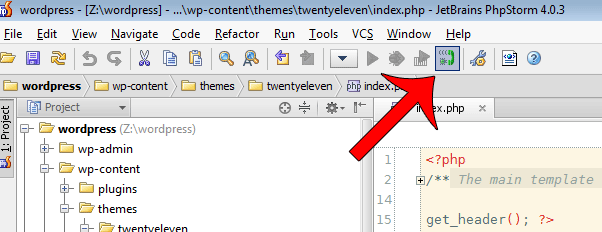
PhpStorm is now ready for an initial Xdebug session. Some more configuration is required in the next steps, but we can at least connect to Xdebug now. Click the “Start Listen PHP Debug Connections” button:
 |
|---|
| phpstorm.startListen.png |
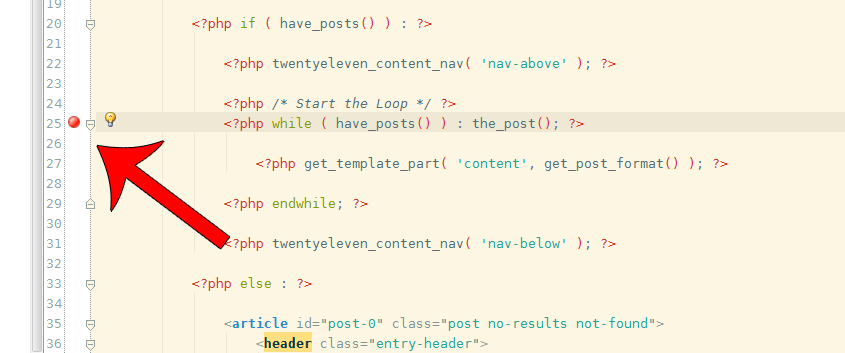
Click the whitespace next to a line of code that contains PHP to set a breakpoint:
 |
|---|
| phpstorm.breakpoint.png |
Go to the page in your browser that corresponds to the file where you set your breakpoint. It does not have to be the exact file, as long as the page you’re loading interacts in some way with the file where you have set your breakpoint.
For example, in WordPress, all routes are forwarded to the main index.php file. In this example I’ve set the breakpoint in the wp-content/themes/twentyeleven/index.php theme file, which gets loaded by every frontend URL in WordPress. This file spins up the full WordPress installation and goes through several files to finally spit out a pretty page. You can set up a breakpoint in any of those files and the execution will be paused as soon as it reaches the breakpoint. Note that the breakpoint only works on lines with actual PHP code, not including opening/closing tags or string-only lines like array keys if they are not on the same line as the array keyword.
In your browser, click the “Start debugger” bookmarklet while on the test domain of your application and then navigate to a page that interacts with the breakpoint you’ve set. In my example I simply have to hit refresh since the index.php file of the current theme gets called in all URLs by WordPress.
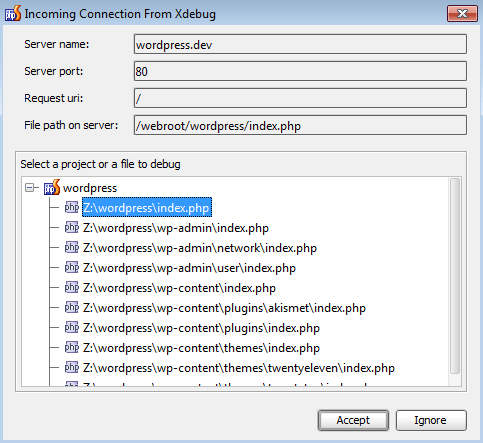
A window titled “Incoming Connection From Xdebug” will pop up, asking if you wish to accept or ignore the connection. Clicking Accept will save the preference so you will not be asked in the future.
 |
|---|
| phpstorm.incoming.connection.png |
Points of Interest
There’s a few interesting spots to point out when a breakpoint is met:
 |
|---|
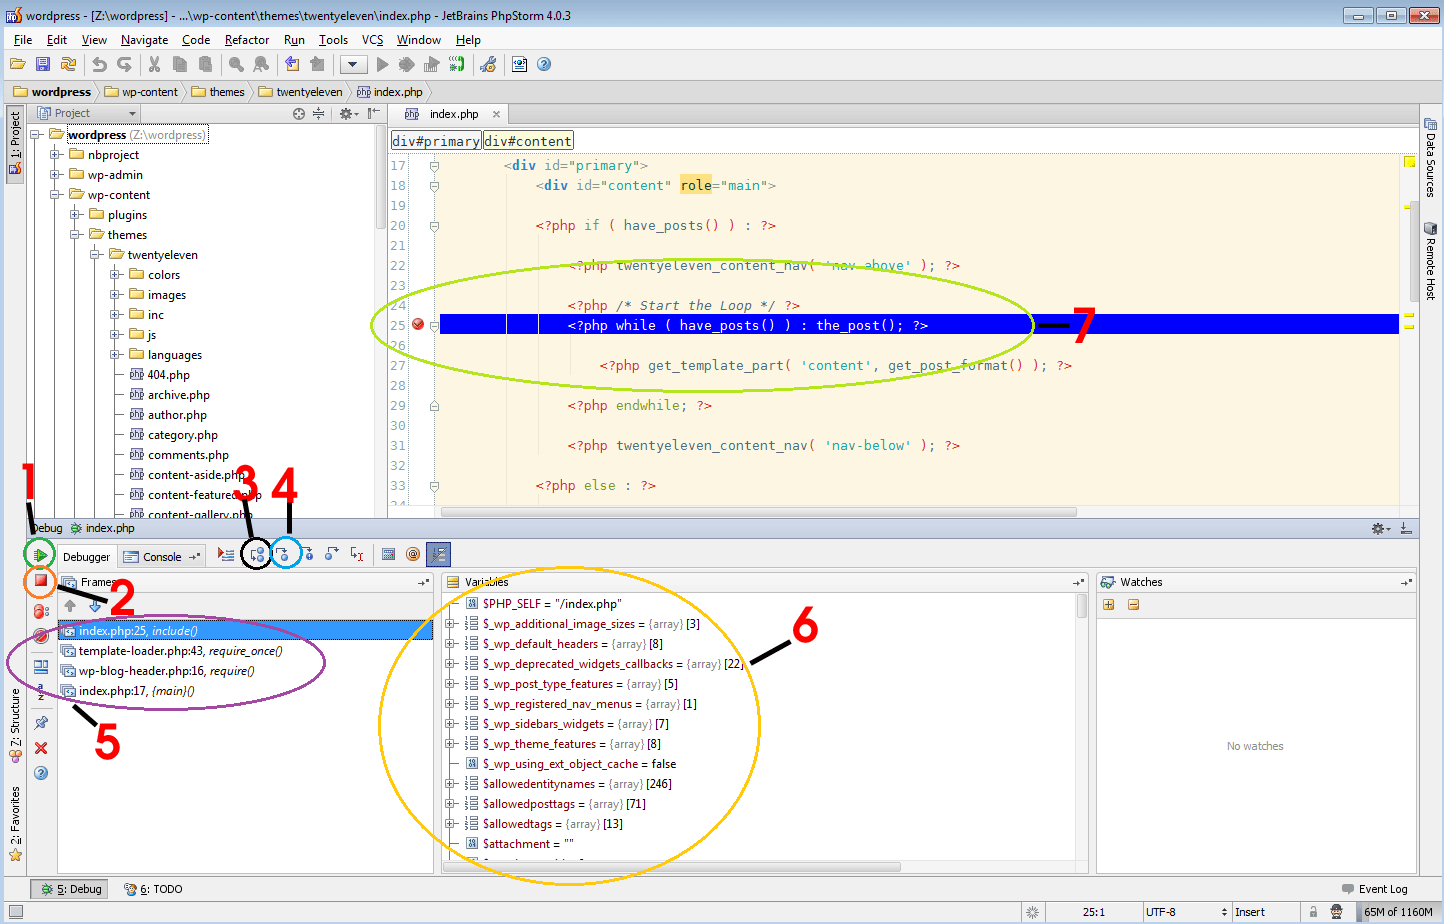
| phpstorm.debug_.overview.png |
- Resume Program (F9) — Clicking on this green arrow allows script execution to proceed to next breakpoint if you have any more, or to end of script as it normally would.
- Stop (CTRL + F2) — Immediately halts script execution.
- Step Over (F8) — Goes to the next PHP line in current file. Does not go into method calls made within current context.
- Step Into (F7) — Goes to the next PHP line in current execution, not just the file. Dives into any method calls made, giving far more detail than Step Over.
- Previous Steps — Shows the steps the script has taken to get to the current breakpoint. In PhpStorm you can click any of the points to go back and see what code was executed to eventually bring you to the breakpoint.
- Variables — Displays all available variables, including objects, arrays or simple variables, at the current breakpoint. Clicking the + sign next to each variable’s name expands it to show you more variables inside. The number to the right inside brackets shows how many variables/keys are inside each. This can go as deep as you’ve set it in your Xdebug config inside your php.ini. Right clicking on any variable brings up a small menu of extra options, including “Set Value…” which allows you to change the value of it on the fly, affecting further script execution.
- Current Breakpoint — The line highlighted in blue is the current line that the script execution has been halted on. Note that since our breakpoint was set on a
while()loop, it can be hit multiple times, which is what happens in this instance for a total of 3 times.
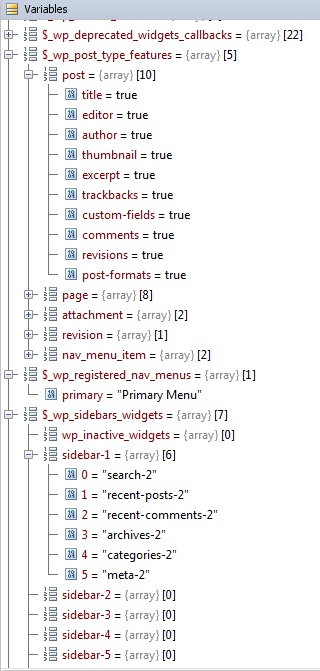
Below is an example of what some WordPress variables contain at this breakpoint. I have not developed WordPress for several years so having an immediate snapshot of what is available to use is a great boon.
 |
|---|
| phpstorm.variable.details.png |
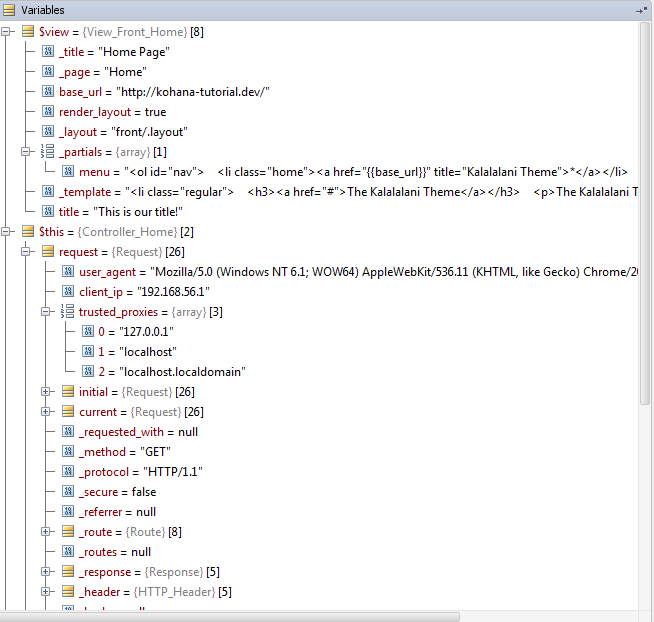
WordPress loves its arrays, but Xdebug is not limited to only that. Below is an example of Kohana Framework variables:
 |
|---|
| phpstorm.variable.details2.png |
Setting up Server Directories
If you are using a VM (you should be), you may have some issues with Xdebug needing to know the location of your current project on the VM.
What this means is that PhpStorm is running on your local machine (your daily driver), and Xdebug is running on the VM, so they’re technically using different filesystems.
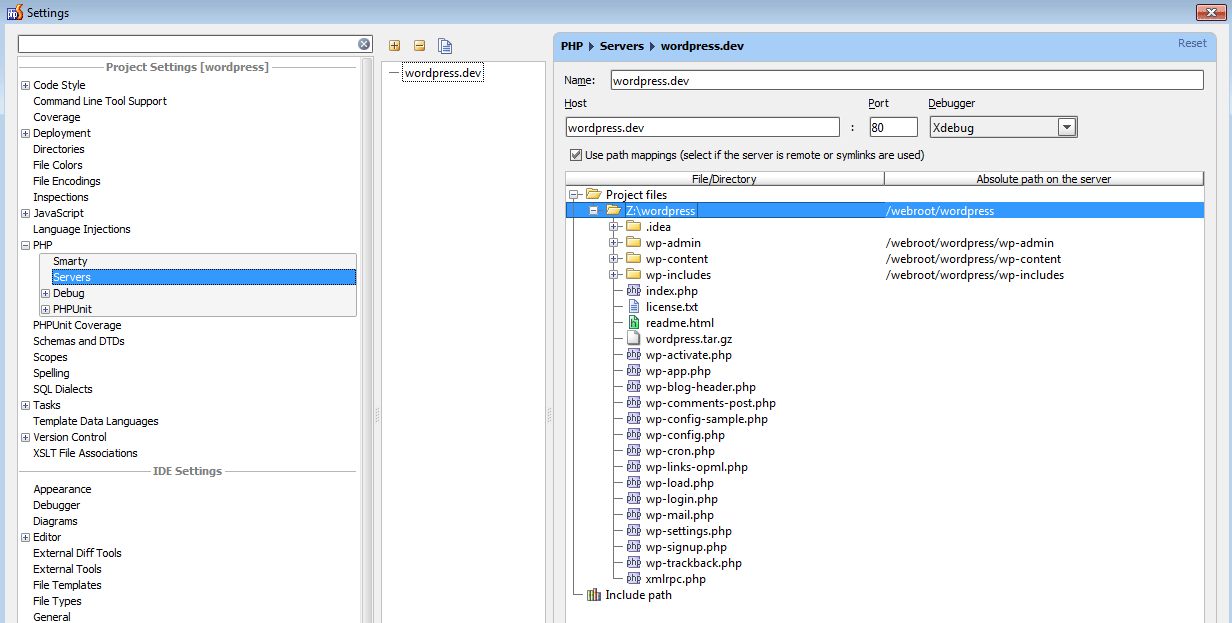
Thankfully it’s fairly easy to do. Go to Settings/PHP/Servers in PhpStorm. Some information may have already been filled in when you accepted the initial incoming connection above, all you have to do now is make sure the rest of the directories are entered correctly.
For example, my VM is mapped to my Z:\ drive on Windows 7, and the wordpress installation is located at Z:\wordpress, but on the VM it resides in /webroot/wordpress/, so I simply need to enter where each subdirectory is located, like this image:
 |
|---|
| phpstorm.php_.servers.png |
This may not be necessary for all setups, and I’ve really only had to do this when symlinks are involved, but it’s always nice to have this knowledge to save you the hair pulling I did to myself!
Unravelling Spaghetti Code
Before I wrap this tutorial up, I’d like to point out a major benefit of Xdebug. Many developers are hired on to help fix a broken, outdated application that was written by the lowest bidder. While some of these applications may work, they are hard to maintain and very difficult to learn.
If you’ve been unlucky enough to inherit one of these monsters, and are having problems figuring out how the application actually works, you can set a breakpoint at the very first line that is executed (or enable “Break on first line” in your IDE) and use the “Step Over” and “Step Into” buttons to follow the execution path taken by the application.
This method helps tremendously in demystifying and clear up all the twists and turns that the code takes, especially in badly designed applications, since it lays everything that happens out in front of you to analyze. Thanks to this trick I’ve saved countless hairs on my head from hair pulling.
Wrapping it Up
Today you’ve learned the what, why and how of Xdebug using PhpStorm. While I’ve concentrated solely on PhpStorm, you should be able to easily implement what you have learned in your IDE/text editor of choice (use an IDE!).
I hope I’ve explained why Xdebug is superior to simple echo, print_r() and var_dump() calls, and I hope you will install it on your local VM and play around with it until you learn to use this great tool in your daily development process!
If you’d like to see instructions for a specific IDE or text editor, leave a comment and I will see about creating a tutorial tailored for it.